In 2020 Webmaster Randal Gaulke is establishing a battlefield tour company, Knee Deep Into History Battlefield Tours, that will provide small-group tours for those interested in military history on a broader range of WW1 and WW2 battlefields in Europe. His first season, late June and July 2020, will include tours of Flanders Fields and the Somme, the Meuse-Argonne and St. Mihiel, Bastogne and the Bulge, as well as some weeks for private tour hire. Readers interested in these tour offerings should consult his website -- just click on the logo:
Don’t worry: Meuse-Argonne.com and the Meuse-Argonne.com Facebook Group are NOT going away! Both will continue to provide useful information and updates for visitors to and students of the Meuse-Argonne Offensive.
So, make 2020 your year to discover the Meuse-Argonne Region of France or get knee deep into history and explore some of the other significant battles of WW1 and WW2.
Bon Voyage!
About the Offensive
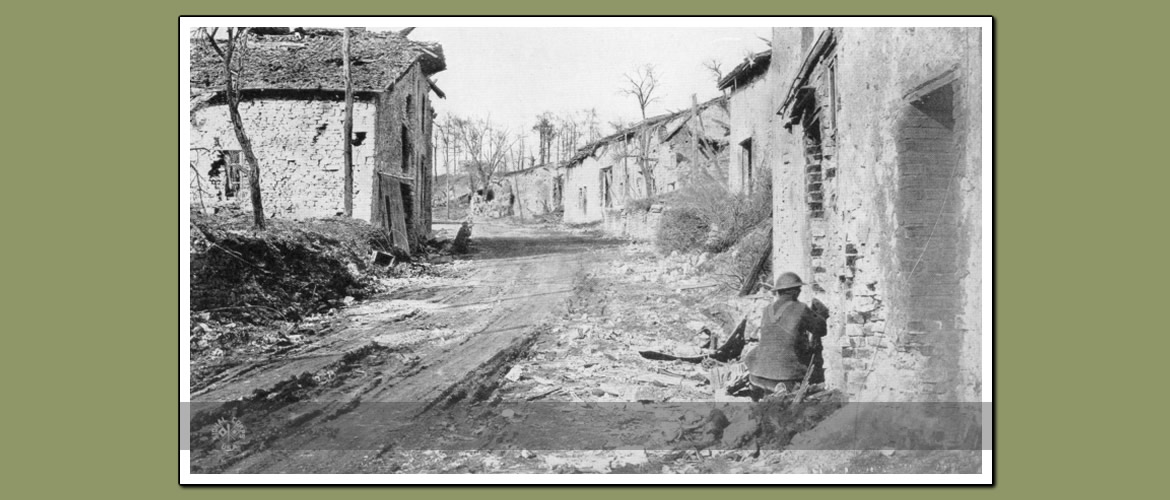
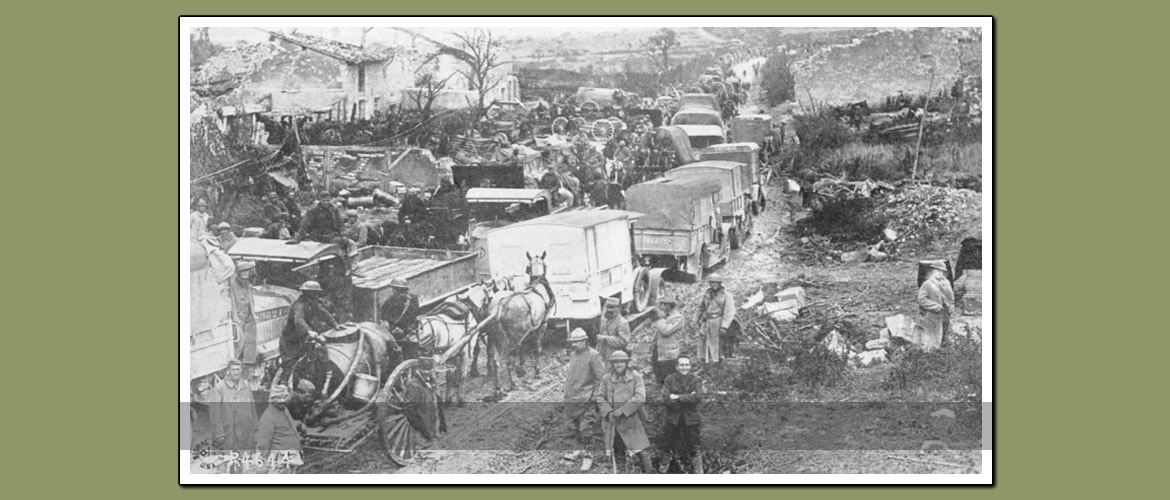
The Meuse-Argonne Offensive was the largest independent American offensive against the Imperial Germany Army during WW1. It began on 26 September, 1918, less than two weeks after the St. Mihiel Offensive ended. The initial assault involved nine AEF divisions—including four green divisions—on approximately a 30-kilometer-wide front. By war end the battle involved portions of 23 American divisions and 1.2 million U.S. troops (not counting French units); and it produced an estimated 110,000 casualties, or more than 2,300 casualties per day. On the other side, the Imperial German Army fought tenaciously well into mid-October; even as signs of defeat continued to accelerate. This website is dedicated to presenting both sides of the battle.
Thanks
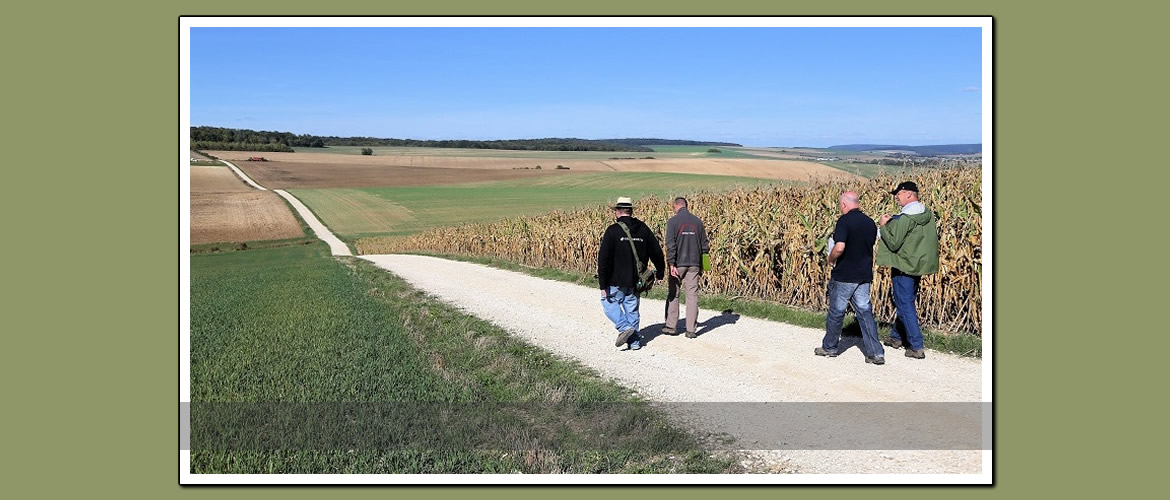
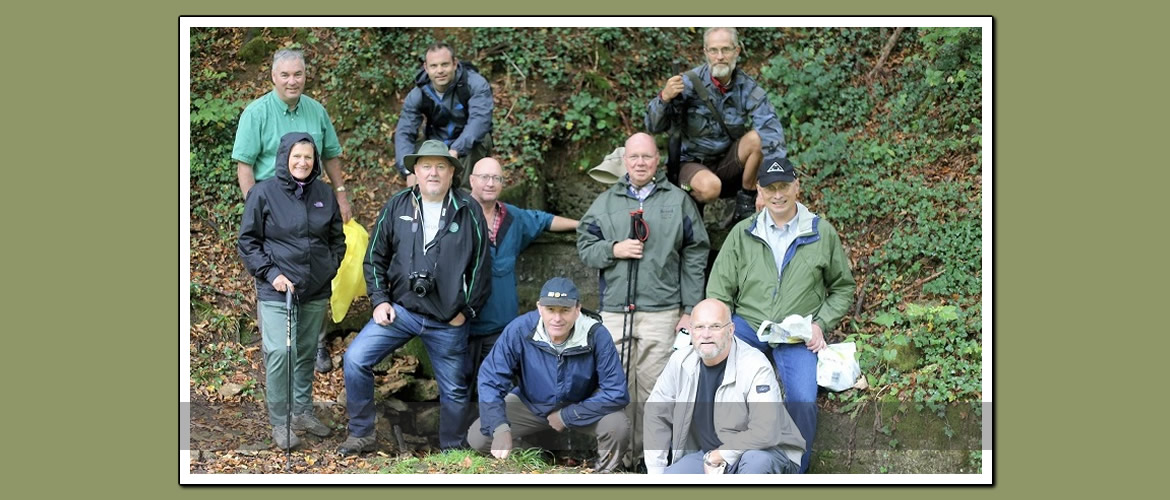
Special thanks to Dave Gaddis and Graham Gaulke for the 2017-18 battlefield tour photos.